Sources of Added Sugars
Sugar is added to food for lots of reasons. Read more to learn the most common sources of added sugars in Americans’ diets.
Learn MoreFor more than 20 years, added sugars consumption has been on a significant decline in the United States.1-5 Since 2000, people of all ages have been consuming fewer added sugars with mean intakes down by 30% (from 24.3 to 16.9 teaspoons equivalents per day).8,9

Daily added sugars intake can be presented in teaspoons (tsp), grams (g), calories (kcals) or % of total calories. The 2020-2025 Dietary Guidelines for Americans7 recommends daily intake of added sugars make up less than 10% of total calories. In a 2,000 calorie diet, this translates to: 12 tsp, 50 g, 200 kcals, 10% of total calories.
| Year | % of Calories from Added Sugars |
|---|---|
| 1999-2000 | 18.1 |
| 2001-2002 | 17.1 |
| 2003-2004 | 15.9 |
| 2005-2006 | 14.5 |
| 2007-2008 | 14.6 |
| 2009-2010 | 13.9 |
| 2011-2012 | 14.1 |
| 2013-2014 | 13.4 |
| 2015-2016 | 12.6 |
| 2017-2018 | 12.9 |
Added sugars consumption in 2017–2018 is reported to be about 13% of total calories, or around 270 calories per day.8,9 This is still slightly above the Dietary Guidelines for Americans, as the 2020-2025 recommendations suggest no more than 10% of calories from added sugars per day.7
What We Eat in America (WWEIA) captures U.S. dietary intakes as a part of National Health and Nutrition Examination Survey (NHANES). This survey is conducted every two years in partnership with the United States Department of Agriculture (USDA) and Health and Human Services (HHS) to assess the health and nutritional status of Americans.10
Dietary data are frequently reported as total added sugars, a combination of the intakes of all caloric sweeteners: sugar, high-fructose corn syrup, honey, maple syrup, etc. But, if we look at just sugar intake, the story is a little different. From 1970 to 2019, consumption of sugar (sucrose) from sugar beets and sugar cane has decreased by more than 30%, a drop from 283 calories (17.7 tsp) per day to 190.4 calories (11.9 tsp) per day.6

While added sugars consumption increased sharply in the 90’s, intakes today have come back down and are very close to what they were in 1970. Compared to 1970, daily added sugars consumption has increased by just 10 calories.6
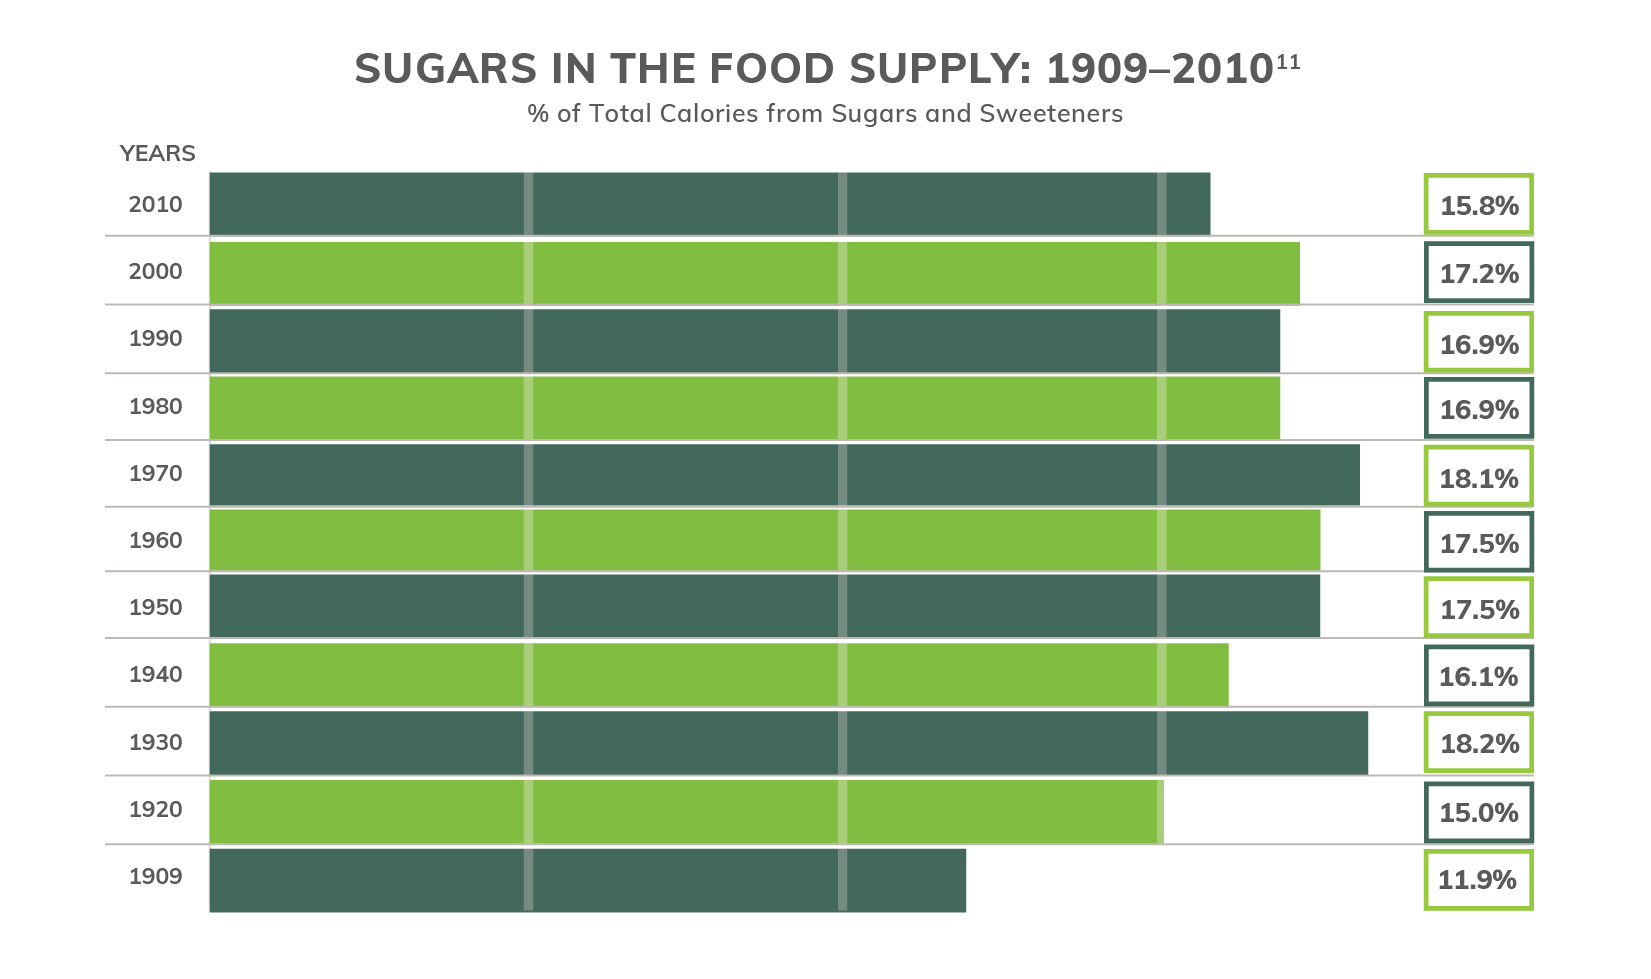
The USDA has been collecting food supply data for a long time! Looking back over 100 years, sugars and sweeteners made up 11.9% of all calories in the food supply in 1909. Over the past century there have been some ebbs and flows in this percentage, the highest being 18.2% in 1997-1999. However, since the turn of the century, the percentage of calories from sugars and sweeteners has dropped steadily. It is important to note that total calorie intake has come up since 1909, but as a percentage of total calories, total sugars and sweeteners consumption is on the decline.11
Did you know that the USDA has been monitoring food supply data since 1909? This extensive history shapes our insights on dietary trends and Americans’ food intake.
For a brief, printable summary of sugar intake trends, click here
Sugar is added to food for lots of reasons. Read more to learn the most common sources of added sugars in Americans’ diets.
Learn More© 2025 The Sugar Association, Inc. All rights reserved.
Get Social with #MoreToSugar